
In the modern economy, trust plays a central role and word of mouth, or WOM, has grown in both reach and frequency.
Customers become prosumers and can be powerful brand ambassadors or strong detractors.
To better measure the brand capable of turning customers into brand promoters, Fred Reichheld published in 2003 in the Harvard Business Review a new metric called Net Promoter Score, often referred to by its acronym NPS.
What does it mean, and how is it calculated?
The Italian translation is "punteggio netto dei promotori". Its meaning becomes clearer when we examine the calculation.
NPS is determined through surveys asking a customer sample one simple question:
Would you recommend this brand/product/service to friends or colleagues?
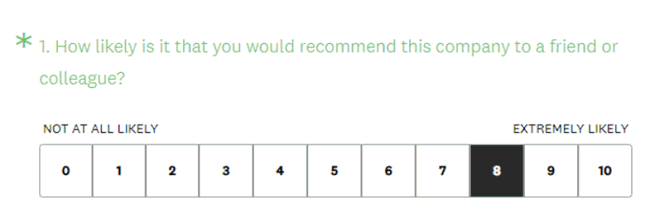
Based on answers from 1 to 10, NPS is calculated using this formula:
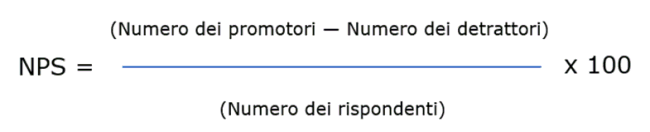
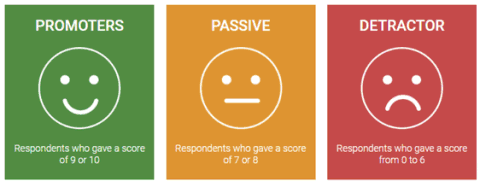
where promoters are everyone answering 9 or 10.
By detractors are everyone giving a score from 0 to 6.
Customers scoring 7 or 8 are classified as neutrals or passives and are excluded from the numerator but retained in the denominator.
Mathematically, NPS ranges from -100 to +100, but a value above zero can already be regarded as positive.
It means that most customers are satisfied.
The calculation weights detractors heavily, so even values above zero are positive. It measures trust, loyalty and the quality of the customer–company relationship.
NPS is widely used in Italy, but must be interpreted carefully: in our culture, scores of 7 and 8 represent excellence, partly reflecting the school grading system.
Paradoxically, if 200 of 1,000 respondents give a brand 6, 700 give 8 and 100 give 9, its NPS is negative: -10!
One solution could be to use categories, allowing answers such as no, yes and definitely.
Scores of +50 or even +70 represent market excellence and place brands among the elite of customer-centred companies.
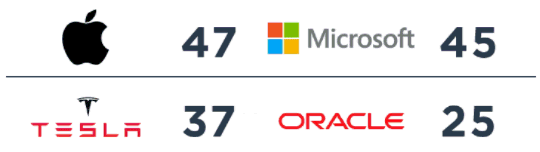
NPS is now the best measure of the propensity for advocacy — customer support for a brand — and positive word of mouth partly because it has become a standard that permits comparisons across markets and brands.
For examples and a sense of scale, Apple scores +47 and IKEA +46.
This KPI must be monitored continuously: it is a key factor in modern marketing strategy based on a pull approach.
The best companies have higher NPS scores than others! The KPI is also typically aggregated by sector, such as food, automotive or banking, to understand satisfaction and trust across a category.
This matters for comparison with the market: a modest NPS of 5 might be best in class if the sector generally suffers low trust and averages -20 — the least-bad effect.
Another interesting NPS characteristic is its flexibility and applicability in different areas.
For example, I can measure NPS for an entire company, a brand, a single product or a specific service.
I might assess a company's app by asking: "Would you recommend using company xxx's app?".