
What are attribution models in marketing?
Sooner or later, you will ask how well advertising campaigns perform and, more generally, how well any market action reaching your target audience performs.
Attribution models help us understand how each medium contributes to the final objective: a sale, lead, drive-to-store action or quote request, depending on the case.
The definition:
An attribution model is a framework or methodology used to determine which touchpoints or interactions in an advertising/marketing campaign have the greatest influence on a consumer’s decision to buy.
This allows us to identify the most effective channels and allocate our advertising/marketing budget accordingly.
Online, the model lets us measure not only advertising but also organic channels (search-engine, social, referral and direct traffic), and how they interact.
For example, it helps us understand whether investment in display advertising is performing better or worse than investment in content marketing (which generates organic traffic).
In theory, it would solve advertising’s great problem, expressed in John Wanamaker’s quotation:
Half the money I spend on advertising is wasted; the trouble is that I do not know which half.
A customer’s path from the emergence of a need to purchase may involve several actions/interactions.
Suppose we need to buy a mountain bike. As this is a complex purchase, there will be several actions and interactions with website X, where I will buy the product.
The attribution model should help us assess each medium’s contribution to the final conversion.
For example:
- I search Google for ‘mountain bike’, click a Google Ads advertisement and make my first visit to website X
- a week later, while visiting my favourite cycling website, I click a banner leading to website X (perhaps a retargeting banner)
- another week later, I search Google for ‘best MTBs’ and click website X’s organic result
- two days later, I see a Facebook ad with a particular promotion from website X, click it and buy my bike.

In this example, company X has three paid interactions and one organic interaction (the Google search).
How do we evaluate each interaction’s contribution?
The weight assigned to each produces a different model. Let’s look at the most important ones.
Last-click attribution (last interaction)
Last-click attribution gives 100% of the conversion credit to the last channel used, the final interaction. In our example, the sale would be attributed to social advertising on Facebook.
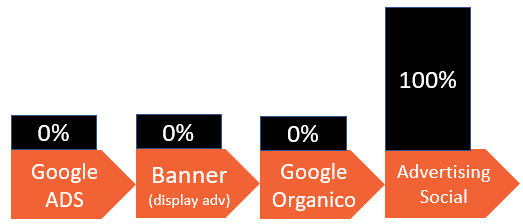
This is the most widely used attribution method and the default in analytics reports.
The model has the advantage of certainty about the final channel before conversion, but gives greater weight to channels closer to the customer’s need and purchase decision.
Once a customer has decided to buy, typical behaviour is to search for the brand name (Bianchi, in our example), then click and interact with either a paid result or an organic link.
In that scenario, Google (paid or organic) receives 100% of the sale credit.
For well-known brands, last click works well. For brands needing awareness work (both paid and organic through a content strategy), it may also be worth looking at the first-interaction model.
First-click attribution (first interaction)
Where the previous model attributed conversion to the last interaction, first click instead gives sale/goal credit to the first contact channel.
In our example, the first channel is the search-engine advertisement (Google Ads, formerly Google AdWords).
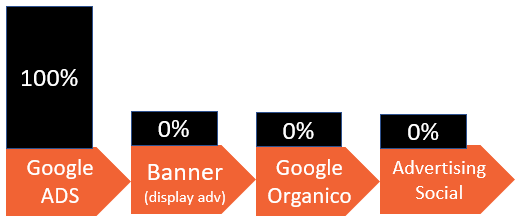
Given the length of purchasing processes, such a system may not always be appropriate, but it is very useful for measuring awareness channels, especially display advertising and content marketing/content strategy.
For example, suppose the first visit to the mountain-bike website was to discover cycling routes or training techniques. The visitor then appreciated the company’s passion and reliability, and later clicked a sponsored ad and bought a bike.
In this case, much of the credit for the purchase goes to the content work that established a relationship and trust.
Similarly, for a little-known brand, banners can generate awareness of the brand and/or the need met by its product or service.
If first click reveals little contribution from display campaigns, their strategy should be reconsidered, since they are clearly ineffective at moving potential customers along the buying path.
Linear attribution
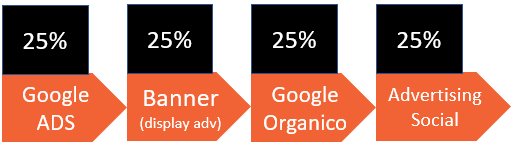
This is the Christian Democrat method of attribution 😂, giving every interaction equal weight.
So, if we sold 100 bikes, 25 would be attributed to each of the four channels.
Remember that, when weighing channels, we also assign them an economic value to calculate return on investment.
Start by defining target CPA (Cost per Acquisition), the maximum cost we can sustain for an online sale. For a €500 mountain bike, it might be €50.
If campaigns generated 100 sales and we assume the same path for all conversions (25% weight), the advertising cost for each medium is calculated as follows:
(individual channel investment / total number of conversions) * 0.25
If this value is below €12.50, all is well; otherwise, our CPA exceeds the target.
CPA is often calculated globally by dividing total investment by the number of online conversions.
While this greatly simplifies the calculation, it risks hiding inefficiencies or ineffective channels.
It is the chicken-average effect 🐔: one person may eat two while another starves 😫
Position-based attribution
This method gives the greatest weight to the first and last interactions, because those channels engaged the potential customer and generated the conversion.
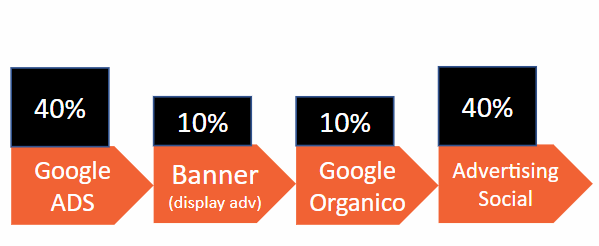
In our example, Google Ads and Facebook Ads receive the largest weight: 40% of the sale each.
Data-Driven Model: the model based on data and machine learning
The data-driven model uses machine-learning algorithms to evaluate all user journeys on our website, both converting and non-converting.
The result identifies the factors influencing outcomes and each touchpoint’s role in the probability of purchase.
The model uses many variables, including interaction sequence, device type, time between visits and purchase, etc.
In effect, it reconstructs a probabilistic model to estimate how interaction with a particular tool along the journey may have contributed to the final conversion.
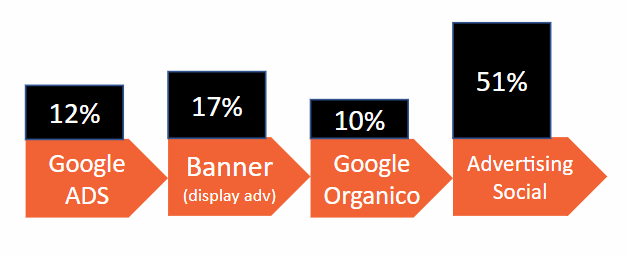
These calculations are used to assign contribution weights, estimating their effect on future interactions.
For example, if the algorithm observes that conversion probability increases greatly when Google Ads is the first interaction, that channel receives greater weight.
Using a football metaphor, it is as though a coach could use past data to establish each player’s contribution to victory in a future match.
How to generate an attribution model with Google Analytics 4 (GA4)
The models examined so far exist thanks to Digital Analytics.
Determining each interaction’s contribution along a customer’s purchase journey would be impossible without a technical tracking system.
Underlying everything is the analytics first-party cookie, allowing subsequent interactions over time to be associated with the same user (cookie ID).
The most widely used and powerful tool is certainly Google Analytics 4. To see attribution-model reports, select Advertising from the left-hand menu, then the subsection Attribution > Model Comparison.
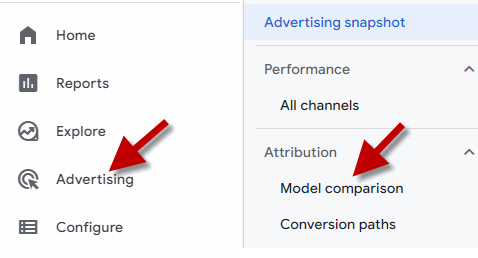
GA4 lists traffic-acquisition channels in rows, alongside conversions calculated using the model selected from the dropdown, compared with the Data-Driven Model.
By default, GA4 shows Default Channel Groups, which group traffic-source categories. Personally, I prefer changing this value in the dropdown to Source/Medium, which gives me more information.
Note that all conversion categories (purchases, leads, downloads, etc.) appear by default. I recommend selecting the specific event at the top (purchases, for example), otherwise you risk comparing apples and pears.
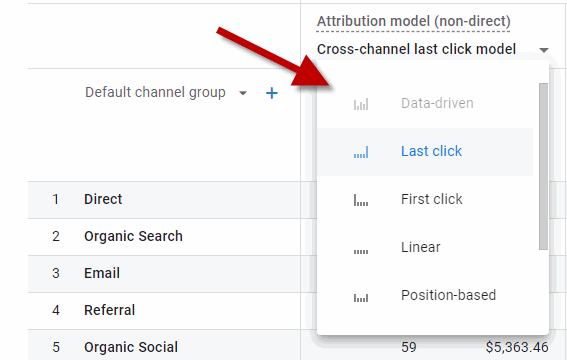
⚠️IMPORTANT⚠️: on 17 October 2023, Google removed all models except Last Click and the Data-Driven Model.
GA4’s attribution model does not consider the direct channel. I like to call it a ‘transparent’ channel.
What does that mean?
GA4’s Direct traffic channel includes visitors who:
- type the website address directly into the browser
- arrive from bookmarks/favourites
- arrive through a QR code
- click a link in a text message or WhatsApp message
- in general, make visits Google Analytics cannot assign to another channel (this category often also includes poorly tracked advertising-campaign traffic)
Returning to the bike-purchase example, suppose the customer interacts through the following three channels over 20 days before buying:
Google Ads > Google Organic > Direct
Under GA4’s last-click model, conversion is attributed to Google Organic, not Direct. The latter is therefore as though transparent 😂
Direct receives conversion credit only when no other channels are involved: in practice, when it is the only way the user arrives on the website.
So, if our customer visited twice within 20 days, both times directly, the purchase would be attributed to that channel.
Direct is excluded in every model. The logical confirmation is that, when changing attribution type, Direct’s conversion values remain the same: those without any other channels before or after in the purchase journey.
When analysing customer journeys for conversion attribution, GA4 uses a 30-day time window.
In practice, no more than 30 days must pass for a sale to be associated with a channel. If I arrive through a Google ad, then return and buy after 35 days, Google Ads cannot receive conversion credit.
To see more clearly how GA4 distributes conversions through data calculations, I suggest opening the following report from the left-hand menu: Conversion paths.
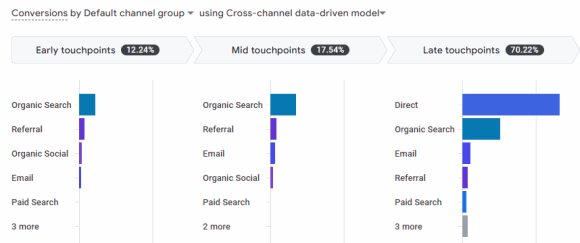
As the image above shows, the report reveals how the various customer-journey stages are weighted using the Data-Driven Model.
Particularly interesting is the path diagram, showing combinations of interactions with their conversions (see the next image).
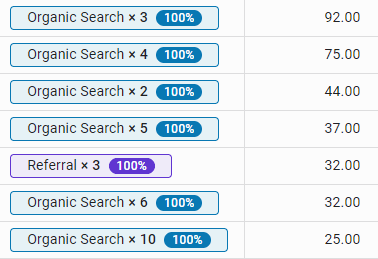
This report is very useful for measuring media working at the top of the journey and assessing assists to the sale.
For example, filtering by source or medium shows how often our banner campaigns appear in a purchase journey.
Few assists mean our campaigns are not working even at the top of the funnel.
Note that the Data-Driven Model requires sufficient data; otherwise, we see the same attributions as last click.
Conclusions and the digital-intolerance technique 😉
Attributing online marketing channels is a major problem for digital investors. The Data-Driven Model is a good attempt to provide an alternative to last click.
Google Analytics 4 has an underlying flaw: the algorithm’s creator is also the world’s leading advertising provider.
The evaluated and the evaluator are the same, using a proprietary machine-learning model whose workings are a black box to us.
Personally, I prefer starting with last click, then analysing TOF (Top of Funnel) media through bounce rate/engagement and assists.
Analytics lets me see how many conversions include the interaction being examined in their purchase journey (for example, how many MTBs did I sell whose journeys include a banner interaction at any position?).
When analysing Display Advertising, be careful to consider only post-click conversions, not post-impression (also called post-view) conversions.
Finally, to clear up any doubt, there is the ultimate technique, which I call: the digital-intolerance model!
In nutrition, identifying an intolerance involves eliminating one food at a time: keeping all variables fixed except one.
If we doubt a tool or campaign’s impact and contribution, we can use the same technique: remove that medium from our investment for at least twice the average customer purchase-journey duration, then examine conversion results.
In practice, if the buying cycle from need to purchase is 30 days, stop the campaigns for 60 days and evaluate the effect on sales during the final month.
The before-and-after difference, if all other factors can be kept constant, represents the channel’s contribution.
I recommend this technique only for advertising channels, not organic ones.
Complex scenarios require assessing many other variables: non-digital advertising (TV above all), competitive pressure (competitors’ prices and advertising intensity), the company’s prices and promotional policies, economic indicators (growth, inflation, etc.) and many more.
AI and machine learning make it possible to envisage broad data-driven models considering many variables.