
The digital revolution has brought exponential growth in available data: we are at the beginning of the era of data overload.
Not only are data volumes increasing, but we also have many more collection sources (set to grow as sources increase), a wide variety of data formats (from social media, the web, apps, Industry 4.0, the IoT, etc.), and an unprecedented speed of production and need for analysis.
The art of modern marketing is the ability to turn data into information, using it to understand phenomena better and make better decisions.
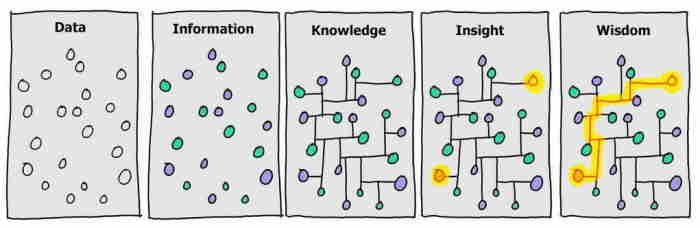
Vint Cerf (inventor of TCP/IP and Google’s Chief Internet Evangelist) says:
The future belongs to those who can collect, aggregate, segment, visualise and interpret data.
Today, we need to master Digital Analytics.
In my view, the best definition of the discipline is provided by Avinash Kaushik (Google’s Digital Analytics Evangelist):
“Digital analysis is the analysis of qualitative and quantitative data from your business and the competition to drive continuous improvement in the online (and offline) experience of your customers and potential customers, translating into desired outcomes (both online and offline).” — Avinash Kaushik, Digital Marketing Evangelist, Google
Digital analytics is a fundamental part of Digital Marketing, a concrete example of the combination of business and technical skills.
It is like knowing how to dribble or make a layup in basketball 🏀

I like the cardiologist metaphor: analytics is like a cardiologist’s ultrasound machine. It is unthinkable that the cardiologist would not know how to use it, read it and interpret it.
If you cannot measure it, you cannot improve it. (Lord Kelvin)
Digital analytics prevents the most widespread practice in all companies: opinionism 😂
It would be like evaluating an athlete’s performance just by watching them.
The marketing process must start with information from the analysis phase, which becomes the basis for the creative process. Finally, data is analysed in the control phase to iterate and refine.
In the modern digital world, the experimental approach becomes a critical success factor in order to master chance and gain a competitive advantage.
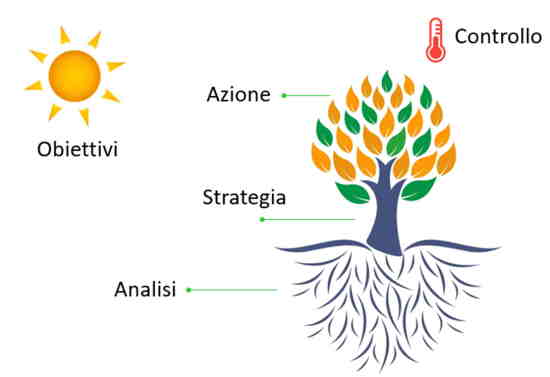
How do you build a Digital Analytics system?
The secret of a Digital Analytics system is setting it up from the beginning (Analytics by design).
It is the windscreen through which we observe our business: setting off without it, or with poor visibility, is unthinkable.
Imagine getting married and, a few months later, wanting to look again at your wedding photographs 🖼️.
Or wanting to admire pictures of your children when they were little, or your dog as a puppy.
You open the album… and there is nothing! 😞😞

Nobody took a photograph 📸.
Can you recover them?
Obviously NOT!
Perhaps we could stage the wedding again ☺️, but turning back time for our children or dog is impossible.
So? 🤔
This is exactly what happens if we do not put an analytics measurement plan in place for our digital properties from the beginning.
As with photographs, if we do not start tracking traffic and strategic actions from day zero, that data will be lost forever.
I know because it is a mistake I made early in my career 👶: caught up in the excitement and urgency of launching projects, I forgot to define what to track and which data to collect to answer business questions. In practice, I forgot to ‘call the photographer’ for my wedding. 🤪
It is a very common mistake in many companies, which often realise too late that they lack the data needed to make strategic decisions.
Over time, I realised the best approach is Analytics by design: measurement must be planned and integrated into the project from the outset.
Do not wait until you need the data to discover you have not collected it.
Design your analytics strategy from the beginning… because you cannot measure the past in the future 😉!
Below are the steps for building an Analytics system:
- ✔️ Understand the mission, business objectives and strategy
- ✔️ Analyse and understand the ecosystem and sources, and make explicit what needs monitoring
- ✔️ How to measure? Configuration. Tagging & Collect (how to obtain the necessary information)
- ✔️ Processing (aggregate, filter, segment, integrate)
- ✔️ Reporting and visualisation
- ✔️ Monitoring, analysis, interpretation and optimisation (KPIs and targets)
Analytics is an integral part of the marketing process, so having clear business objectives and strategy is essential.
For example, suppose we sell running shoes online (e.g. Mister Running). Our mission could be (I am making this up): ‘We help you choose the best shoe for you, and you receive it the next day, ready to test.’
The strategy could involve a configurator that helps customers choose shoes based on their physical characteristics and personal goals; we also have an online adviser who can help through chat.
The objectives can clearly include online sales, but also customer interactions (perhaps they do not buy immediately but do so later), upselling and loyalty.
Once this is done, we can move to the next stage and map the previous points against the existing ecosystem to understand what to measure.
At this stage, we first need to ask all the questions we would like to answer
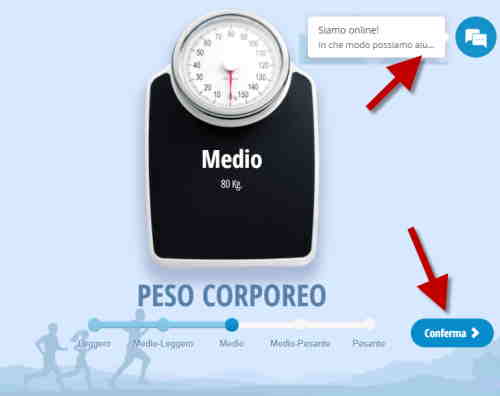
The Shoe Finder configurator at www.misterrunning.com
Alongside website conversions and funnels, it will be important to see how many people use the configurator Mister Running provides to help customers find the right shoe.
How many start it? Where do they stop? Do they submit a video of their gait? Does conversion increase among those who used it? Is the purchased product consistent with the recommendation?
Use of the adviser chat is another element to measure.
As we can see, the information obtained about these elements tells us whether we are on course with our mission and strategy.
The next stage is more practical: how do we measure?
At this stage, we work out which tool best serves our objectives.
Classic mistakes include starting with the tool rather than what we want to know, and/or using too many tools for the same objective.
This is where data issues arise: availability, quality, integration and timing.
The measurement method also depends on the tool. Online, the standard is client-side (browser) tracking, using tagging systems and passing information to the tracking engine.
For example, events (or virtual pages) can be configured for opening the chat, telling us how many people open it and recording all subsequent steps.
During configuration, we also need to set goals: in other words, mark the most important events differently.
In our example, these could be configurator sessions started and completed.
We must know from the outset which questions we want to answer, so that tracking can be configured accordingly.
If I wanted to know afterwards how many people in my restaurant ordered the Adriatic version of fish soup, I could only do so if I had set up an order-recording system (preferably digital) that captured the figure for later processing.
After launching a new project/product, questions often arise retrospectively that cannot be answered because the data was not collected at the start 😲
Data processing now takes less and less time, and some tools even provide real-time data.
This stage also includes integration between multiple sources, such as bringing together data from online advertising campaigns.
Reporting and presenting information are critical and increasingly important. The ability not to drown in data, to synthesise it and present it well, is a refined art.

There are two levels of reporting and visualisation: internal reporting to understand phenomena properly, and reporting for a wider audience.
The second is linked to interpretation: when communicating the findings, we also provide interpretations that help people make better decisions.
Monitoring KPIs (performance indicators) tells us whether we are on the right track.
Returning to our example, we would examine reports on website traffic (broken down by source), online sales, baskets started, configurator sessions started and completed, chats started, etc.
Optimisation is continuous. Sometimes interpretations require further data that was not collected previously, so we return to the configuration phase at step 3 of our system.
Website analytics: what are the main questions we need to answer?
Below is the main information we must be able to report about our website, or our digital properties in general.
- ✔️ How many visitors come to my website each day, week and month?
- ✔️ Where do they come from?
- ✔️ What are the best traffic sources?
- ✔️ Which online investments and campaigns generate the most traffic? What is the quality of that traffic?
- ✔️ Which devices do they use?
- ✔️ Out of 100 visitors, how many buy (conversion rate)? From which channels?
- ✔️ What do visitors do on our website? How much time do they spend there?
- ✔️ What interests them most? Which content? Why do they come?
- ✔️ Which strategically important actions do they take, and how many?
- ✔️ What do they buy?
- ✔️ What path do customers follow to purchase? Where do they drop out of the buying process?
- ✔️ Which hypotheses/experiments do we want to test/validate?
With these questions in mind, we can configure our analytics appropriately and create clear reports to understand what happens on our website, and therefore in our business.