
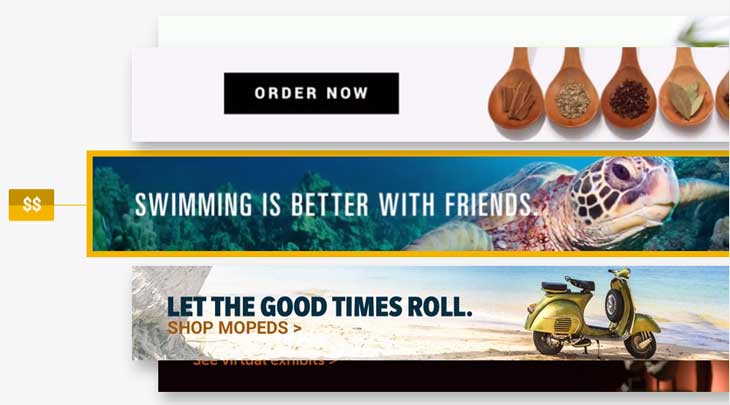
Advertising is the marketing tool best known to the general public, and it has evolved considerably over the last 100 years.
The feature shared by the main advertising media is “interruption”: interrupting media consumption to communicate with a potential customer. A television or radio commercial interrupts the experience of a customer following a programme to deliver an advertising message. The same applies to print and, generally, to all below-the-line communication.
 An old cigarette advertisement, from when doctors and dentists recommended them!
With the arrival of the Internet and the web, a new channel appeared on the horizon. Yet despite the huge growth of online audiences, the Internet struggled considerably to secure a share of advertising investment.
Online advertising borrowed the same logic as offline advertising, relying on interruption.
The first online banner in history appeared on the famous web magazine HotWired back in October 1994. It was a banner for telecommunications company AT&T and recorded a 44% CTR!
.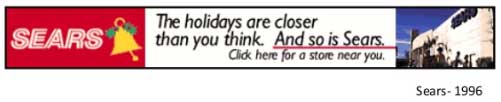 A Sears leaderboard banner from 1996
The advertising market in general is a market for attention: we pay to obtain a tiny piece of our potential customer's attention.
But the supply of attention and customer behaviour have changed greatly over time.
Today, during our everyday activities, how often do we interrupt ourselves (to check social media, email, news and so on) or get interrupted by private messages, unrelated to advertising?
Compared with 10 or 20 years ago, that figure has multiplied tenfold! Indeed, today we have a serious problem with people's loss of concentration . People once consumed few media, in a linear way, and direct communication that was not face-to-face was largely confined to the home landline or door-to-door contact.
In this scenario, what role can tools that still rely on interruption continue to play?
Below, we examine the historic form of online advertising known as display advertising.
What is display advertising?
Simply put, these are advertising messages made up of images, text, video and audio, displayed on websites, mobile sites and apps.
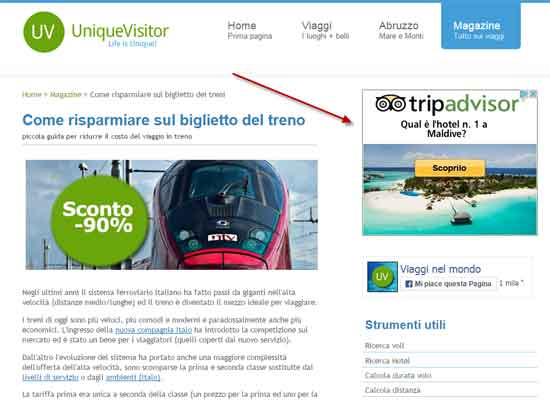 Example of a 300 × 250 inline rectangle banner
Typically, in a display advertising campaign (and generally in all online campaigns), we can identify the following elements:
- Advertising format
- Delivery channel
- Buying method
- Exposure rules
Display advertising format
The best-known formats are those specified by the IAB and which we often see online. Here are some examples, with their type and dimensions in width and height.
- Vertical rectangle: 240 x 400
- Mobile leaderboard: 320 x 50
- Banner: 468 x 60
- Leaderboard: 728 x 90
- Square: 250 x 250
- Small square: 200 x 200
- Large rectangle: 336 x 280
- Inline rectangle: 300 x 250
- Skyscraper: 120 x 600
- Wide skyscraper: 160 x 600
- Half-page: 300 x 600
- Large leaderboard: 970x90
- Large mobile banner: 320 x 100
- Billboard: 970 x 250
- Portrait: 300 x 1050
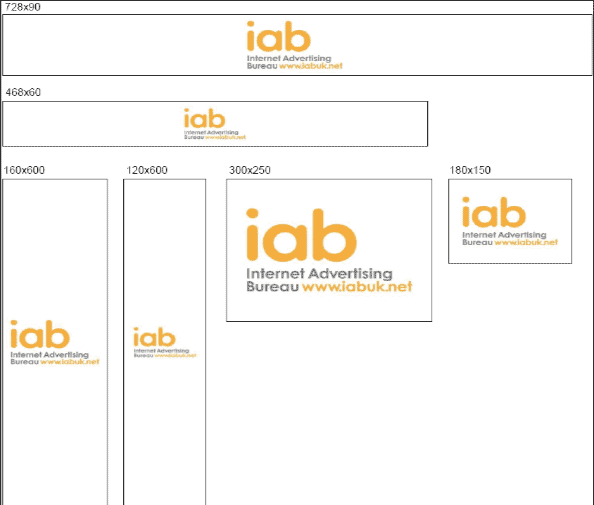
Illustration of some standard IAB formats
To these we must add all rich media formats: those including video, audio or other elements that encourage the visitor to engage with the content.
Below is DoubleClick's list: https://support.google.com
There is also the entire category of formats and rich media offered by specific players such as YouTube, Facebook, Google and others...
With video, there is linear advertising in pre-roll, mid-roll and post-roll, or non-linear advertising, where the format appears alongside the video.
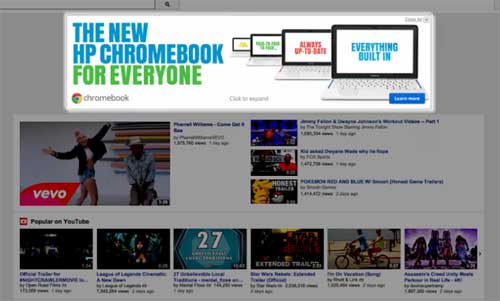
Example of a YouTube masthead format
On the Google support site, you can explore all available formats and how they work.
Over time, many custom formats have been added according to the campaign's characteristics and delivery channel. Many publishers also offer bespoke special projects for advertisers.
To see the formats a site supports, look for the “Advertising” link, usually at the bottom in the footer. For example, at the bottom of the Corriere della Sera website there is a link to its sales house, RCS Communication Solutions, listing the sites it manages and all available formats: http://www.rcscommunicationsolutions.it
Delivery channel
By delivery channel I mean the platform, primarily desktop or mobile, followed by the type of destination site: a niche content site, a general-interest site, a service website (weather, translation or a speed test, for example, as in the image below), a mobile app, and so on...
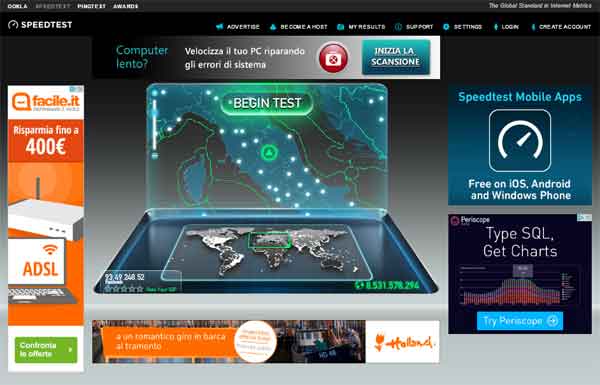 The speedtest.net website, showing its different advertising formats
Buying method
The main methods are:
- CPM, the traditional system of buying thousands of impressions (cost per mille). A CPM of €5 means paying €5 for every thousand banner views (impressions). The model resembles television advertising, but, as we will see, the final results differ somewhat.
- CPC (or PPC), cost per click or pay per click: I pay only when someone clicks my banner. The best-known model is certainly Google Ads for the Display Network.
- CPA, cost per acquisition or action: the advertiser pays for acquisitions made through the banner. More broadly, this includes all systems known as affiliate marketing (the main ones in Italy are Awin/Zanox and Tradedoubler).
- CPL, cost per lead, halfway between CPC and CPA. Here, obtaining a lead rather than a signed contract is enough: for example, a customer who clicks the banner and leaves an email address or phone number to receive more information about the advertiser's offer.
- Time-based, similar to sponsorships in which the advertiser takes a placement for one or more days.
To understand how the market works better, below is a diagram in which I have tried to summarise the value chain and its participants.
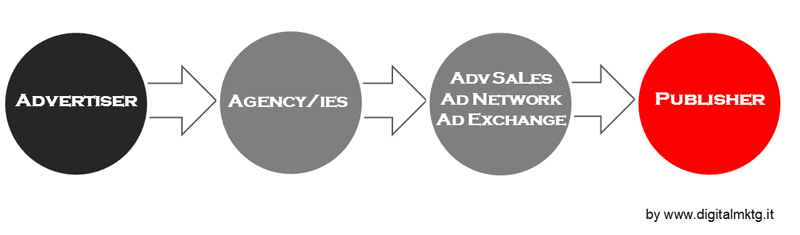
Participants in the digital advertising value chain
Let us start with the two ends: the advertiser and the publisher.
The first is the brand or any company wishing to advertise online using the formats we saw earlier.
To meet this need, it must find websites and digital properties that sell advertising space. These are publishers, which have content visited by a particular audience (the concept of publisher should be understood broadly, extending beyond editorial content).
Between the poles of supply and demand are other participants and systems that make the process possible.
An agency guides the company through the market. Its role can be as broad as desired and includes digital consulting, media planning, creative work and banner production, buying placements, reporting and analysis.
Different agencies can also carry out these activities. Typically, creative work and production are separate from media planning, which is handled by the media agency.
Once the campaign goals have been defined with the client, the agency goes to the market to buy placements.
We now reach the box I have summarised under three headings: advertising sales, ad networks and ad exchanges.
Historically, large websites created a sales house to sell their space (inventory), with a network of sales account managers and an ad-server technology platform.
The ad server receives instructions about campaigns to run and handles delivery and impression reporting. Sites managed by the ad server contain a specific tag with a script that communicates with it.
Banners used to be uploaded to the ad server too, but for some years this function has been handled by advertiser ad servers, which store campaign creatives. In practice, instead of sending the banner to the visitor's browser, the ad server sends a script acting as a bridge to retrieve it from the advertiser's servers. This step is fundamental to making buying and delivery more efficient and scalable, but also adds a potential weak link to the chain.
Sales houses typically do more than sell their parent publisher's space: they seek to build a network of other digital properties to maximise the commercial relationship. In practice, sales houses are standalone companies with every incentive to expand their inventory.
When buying display advertising, media agencies can turn not only to sales houses but also to Ad Networks, which, as the name suggests, bring together publishers and offer placements based on subject areas (for example, motoring sites only), audience type (women aged 20–40), or buying method (CPM, CPC, CPA, CPL and so on).
Ad networks also receive placements not sold directly by sales houses, known as unsold inventory.
Agencies and media agencies are paid for their work in two ways:
- Agency commission: a percentage of the value purchased or a flat fee. Many agencies no longer use the first method and report costs to the advertiser net of commission.
- Overcommission or negotiation fees: advertising sales houses agree with media agencies on bonuses when the latter reach a certain total volume of business. In practice, the more space a media agency buys from a sales house, the more money it receives. These can also take the form of year-end rebates, media volume discounts or free placements.
As you can imagine, point B creates conflicts of interest. The media agency should act in the advertiser's interest, not the seller's! Overcommissions are commonly called kickbacks. Contract clauses requiring media agencies to return negotiation fees do not solve the problem, because the client will never know the true exchange with the sales house, which, as we have seen, can combine many forms.
For transparency in the Italian market, this distortion should be eliminated through legislation, as happens abroad, rather than relying solely on operators' honesty.
The buying process has evolved considerably recently thanks to automation.
Automation has become possible through ad exchanges: technology platforms where demand (through a DSP, demand-side platform) and supply (through an SSP, supply-side platform) meet, and orders are handled automatically by ad servers (programmatic advertising).
These platforms can manage any type of transaction, from traditional premium deals in which a sales house sells on a CPM basis with guaranteed delivery in defined positions, to real-time bidding systems where different buyers bid for each impression through DSPs according to variables such as audience type, remarketing cluster and geolocation.
Some time ago, the Incorporated Society of British Advertisers commissioned PwC to investigate where money invested in programmatic advertising goes, answering the question: “what does my programmatic supply chain look like and how can I assess its value in terms of working media?”
The research revealed the system's extreme complexity (reconstructing everything took a year): up to 20 different participants may be involved in a single ad placement.
For 15 advertisers, they identified no fewer than 300 distinct supply chains reaching 12 publishers.
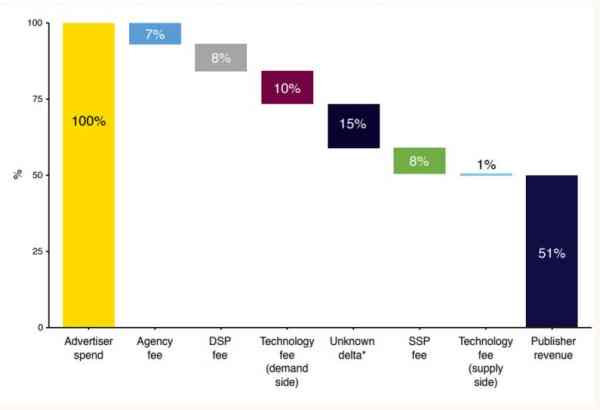
Where programmatic money goes
Out of every 100 the company spends, half (49%, to be precise) goes to the chain, including all adtech and agency fees, leaving 51% for the publisher.
So far, it is simply something to be aware of. But the biggest problem is transparency: almost a third of the first spending category is a complete mystery, and PwC could not explain where it went.
Display advertising goals
We can identify the following broad goals:
- creating brand awareness
- awareness of a need, product or solution
- reminding people of the product or service after visiting our site (remarketing/retargeting)
- promotional push (for example, launching a specific promotion)
- visibility for the content strategy, to provide value and acquire leads
- traffic acquisition in general: engaging visitors and bringing them to our website or landing page
These goals are very challenging today because visitors' and consumers' behaviour has changed greatly over time, requiring more careful, precise strategies than in the past.
The goal determines the audience type, channel and format, working along the traditional dimensions of reach, frequency and message impact.
To build awareness of a new sports product, we might choose the homepages of leading sports newspapers as our channel and a takeover as our format.
Metrics for measuring campaigns
Let us follow the visitor's path from the perspective of a company investing online and examine the metrics to monitor.
Display advertising evaluation metrics:
- Impressions: the theoretical reach and frequency of our message delivered through the ad
- Potentially visible banners (ad viewability): banners that the user could technically have seen (see the dedicated section)
- Banners seen: banners the user actually sees. According to eye-tracking, this figure is currently very low.
- Clicks: the only measure that would demonstrate the banner was read, after accounting for accidental mobile clicks and fraudulent traffic, which we will discuss later.
- Bounce rate: the bounce rate on the landing page. It tells us whether, following the click, the visitor continued browsing or stopped at the first page (100% means visitors always stopped at the landing page).
- Post-impression conversions: conversions (purchases or leads) made by visitors who received an impression, without clicking, at some time before converting. In practice, if a week ago I read an article on repubblica.it with company A's banner somewhere on the page, and later bought something on that company's site, it counts as a conversion generated by the banner. Regardless of whether the banner actually loaded on the page, was displayed and was then seen!
- Assists: when measuring contribution to a conversion (lead or purchase), display's presence in the buying process is analysed. For example, if I first clicked a banner, then returned through a search engine to buy, the conversion is attributed to search, but display's contribution is recorded as an assist.
- Post-click conversions: people who generated a lead or purchase after clicking a banner. Following the previous example, I might first enter the site through search, then return via a banner to complete the purchase. In that case, display is credited with the conversion.
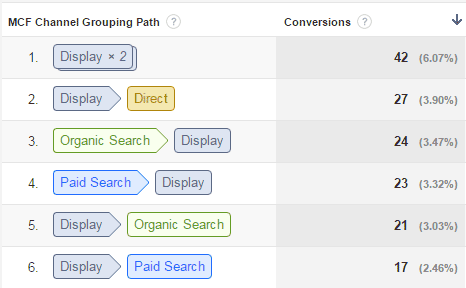
Example of a multichannel display assist in Google Analytics
Risks, caveats and developments
Do you remember the last banner you saw? And the last banner you clicked?
Try a game with friends or colleagues: have them read a web page, then ask which advertisements were on it.
The result? Banner blindness!
At best, people are completely indifferent to these ads! Our brain excludes them from its processing of the page (the viewer fatigue effect).
Let us examine the phenomenon carefully to find solutions.
Ad viewability
To understand how many advertising messages can reach visitors' eyes, we must first consider viewability: whether the banner is actually visible to the user.
As we have seen, the impression is the ad server's technical metric telling us whether the banner was sent to the user's browser, and it is the basis for billing.
In reality, this tells us nothing about the banner's potential to be seen. There are many reasons why advertising may escape our notice even if we wanted to see it:
- the banner may be below the visible portion of the page
- the visitor may have scrolled or clicked a link and skipped the ad
- the ad loads in another browser tab while the user is reading a different one
- the creative is too heavy and becomes visible only after the user has scrolled down or changed pages
- ad redirects and/or latency in the servers delivering the campaign (we have seen that banner delivery now involves several servers, the last of which sends the visual; RTB buying makes the problem worse)
- connection speed
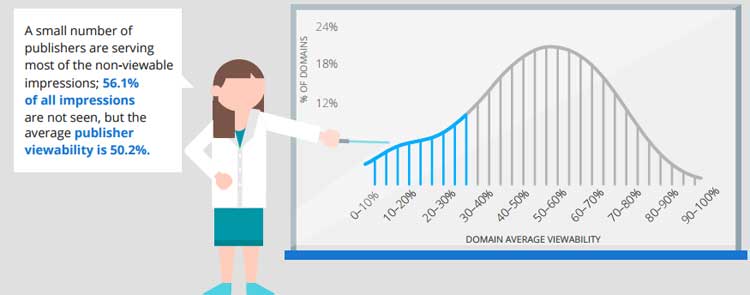
Data taken from the report by Google–DoubleClick
Google calculated the percentage of potentially visible banners, and the result is striking: more than 50% of ads can be considered non-viewable!
Aware of the effects on the market, the main players, led by Google, are moving towards guaranteeing 100% ad viewability.
US operators were the first to highlight the importance of viewability. In 2011, the 3MS consortium (Make Measurement Make Sense) was formed, bringing together the ANA (Association of National Advertisers), the 4A's (American Association of Advertising Agencies) and the IAB (Interactive Advertising Bureau). Its goal is to work with certification bodies (the Media Rating Council in the US) on a standard separating the concept of a served impression from that of a viewable impression.
Here are the viewability guidelines: http://www.iab.com/guidelines/state-of-viewability-transaction-2015/
An important element of the guidelines is the definition of a viewable banner:
An ad is considered viewable if 50% of its pixels are displayed for at least one second. A desktop video ad is considered viewable if 50% of its pixels are visible for two seconds.
Google introduced a product called vCPMs on the DoubleClick platform, offering guaranteed viewable impressions. Instead of selling on a CPM basis, ads can therefore be sold at vCPMs, meaning viewable CPMs.
IDG Communications (which runs PCWorld and MacWorld) already sells at vCPMs in the United States.
Ad blockers
The most extreme source of blindness is certainly ad blocking. Visitors are not merely ignoring banners: they want to remove them altogether.
The mechanism is very simple. Once installed, including as a browser extension, it blocks calls to the ad server using a filter list and rearranges the page to fill the spaces left empty by banners.
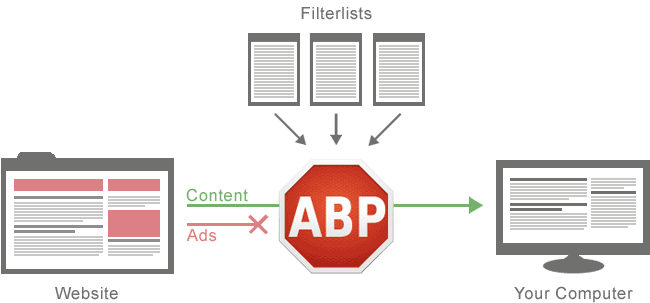 How ad blocking works
The best-known desktop options (PC and Mac) are AdBlock, AdBlock Plus, uBlock and uBlock Origin. On Android smartphones there are AdBlock Plus and Adblock Fast. On iOS: Crystal, 1Blocker, Purify, Refine and AdBlock Plus.
Chrome extensions make it easy to install and unobtrusive.
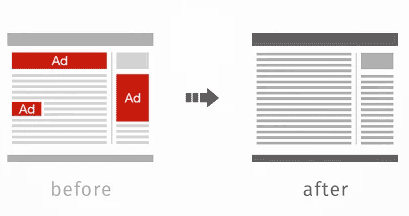 The page reformatted after removing ads
As the chart below shows, adoption of this software is surging. Globally, growth of 41% was recorded from 2014 to 2015.
Penetration is 25% in Germany, 22% in the UK and 13% in Italy. Figures are higher among men under 24.
On telecommunications and technology sites in Italy, the figure has already reached 30%.
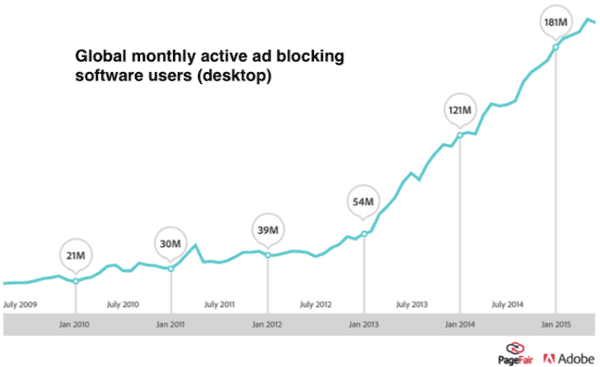 Ad-blocker trend (source: PageFair and Adobe)
Ad blockers have existed for some time, but their recent growth sends an important and worrying signal to the advertising market. At this rate, it will take only a few years for every browser to have an active ad blocker!
The problems the market must face are clear:
- strong visitor distrust of and annoyance with the medium
- risk to business models based on push advertising, both major publishers and niche specialists
- difficulty for advertisers in reaching certain audiences (for example, a brand targeting technology enthusiasts)
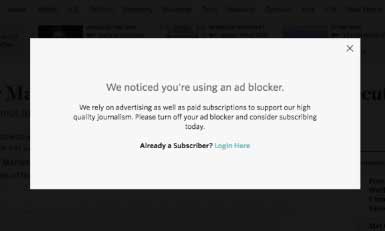 www.wsj.com's message to its readers
To contain the problem, some major publishers have begun communicating with visitors using ad blockers. Above is the Wall Street Journal's message, and below the New York Times'.
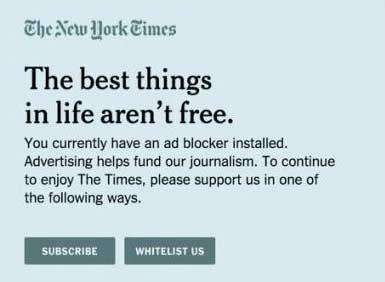 The New York Times' message to its readers
CTR — Click-through rate
We have seen that a large share of display advertising cannot be seen by visitors in the first place. But what happens when they could see it?
The earlier test and our practical experience as web users should already give us the answer. One indicator, however, summarises the phenomenon better than others: click-through rate, the percentage of clicks on delivered banners (clicks/impressions). This is the first indicator telling us whether a banner was actually seen.
In 1996, CTR was 7%; in Italy in 1998, it was around 2%.
Today, the average for standard formats is 0.04%!
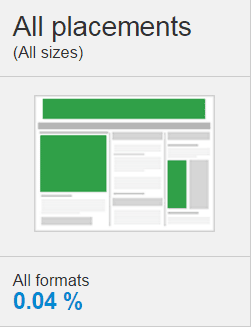
Average CTR in Italy for the formats shown in the image (source: DoubleClick)
Unfortunately, we must also consider that:
- 50% of clicks on mobile banners are accidental. (Source: GoldSpot Media 2015, also reported by Google)
- click fraud exists (discussed in the next section)
- 8% of US users make 85% of banner clicks (source: ComScore; the figure dates from 2009, but given the phenomena described so far, I do not think the proportion has changed)
So even a click does not guarantee that the banner was seen :-(
Fake/fraudulent traffic
The last phenomenon I want to highlight is, in my opinion, the most worrying: fraudulent or fake traffic.
Fraudulent traffic means traffic coming from bots rather than humans. Bots are programs or applications that automatically perform actions online, simulating human activity.

Bots spread through malware. Once a computer is infected, it can be controlled and, through a virtual browser, generates banner views, clicks and leads. These activities blend with the infected computer owner's normal, intentional browsing, making them difficult to identify.
Hackers have long understood that gaining control of computers to generate and steer browsing traffic is much more profitable than stealing information from them.
The bot boom in display advertising is more recent, but it continues to grow thanks to the widespread adoption of automated programmatic buying through ad exchanges.
Today, the market focuses heavily on buying audiences with certain attributes. Through networks converging in ad exchanges, purchases happen automatically, in bulk and very quickly.
In practice, we could say that automation has created its own dark side: the bad automation of malicious bots.
A Wall Street Journal investigation estimates that 36% of traffic is fake.
A very thorough study for the ANA (the US Association of National Advertisers) carried out by White Ops reports that bots generate 11% of display advertising traffic and 25% of video advertising traffic (The Bot Baseline: Fraud In Digital Advertising ).
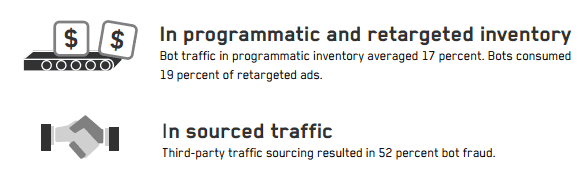
In programmatic, the figures rise to 17%, and in retargeting to 19%. Sourced third-party traffic even records 52% bot fraud.
Fraudulent-traffic professionals start by building an audience through one or more websites or apps, feeding their traffic with the zombie computers they control. Soon they can join ad exchanges and ad networks. After that, the rest is simple: keep pumping traffic to earn proportionately.
Another common technique is selling traffic cheaply to publishers. The flow is partly real and partly bot-generated, depending on how much the buyer wants to spend. Naturally, these sourced-traffic suppliers do not disclose its fraudulent nature, and nobody asks them either.
For advertisers, the major risk is receiving impressions generated by low-value audiences or bots. As the diagram below shows, bots have evolved and offer not only impressions but clicks, video plays and likes too.
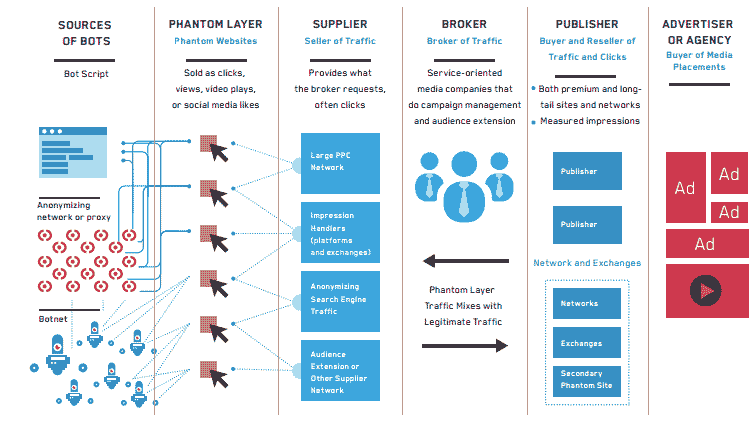
The fraudulent system's operation, reconstructed by the ANA
Without swift action, these figures are destined to grow substantially, considering estimates that programmatic buying will reach 80% of the market in the coming years.
Ad exchanges do not disclose to agencies and advertisers where impressions are delivered. Besides preventing fraud monitoring, this raises the issue of exposure quality (ad relevance). In practice, our message risks being associated with sites or content inconsistent with the brand.
Alongside malware, we must also consider adware, which generates large quantities of poor-quality traffic. Here the visitor is theoretically aware of it, but the effect on the advertiser's brand is actually negative, without the advertiser knowing.
Besides stealing the advertiser's money, fraudulent traffic distorts all digital marketing analyses and assessments of display's contribution to purchasing.
The World Federation of Advertisers (WFA) estimates that advertising fraud will become the largest market for organised crime.
Conclusions and solutions
A brief recap:
- Around 20% of people block banners, particularly men and young people, and the figure will grow
- More than 50% of people have no technical opportunity to see the banner
- Between 10% and 20% of traffic is fake because it is generated by bots, and unfortunately this figure is also set to rise
- 50% of mobile clicks are accidental
For what remains, we would have to assume that banners actually delivered and potentially visible to the visitor are really seen!
The only tool that might guarantee a user noticed the banner is a click, but here too we must discount fraudulent and accidental mobile clicks, which are growing sharply in absolute terms.
Moreover, by definition a banner is interactive, and the measure of interaction is precisely the click, whether the goal is awareness or performance.
Given the nature of the medium and the effects described above, it is difficult to assign a defensible value to mere banner exposure without a click as a contribution to customer acquisition. Assist and post-impression conversion metrics are highly uncertain and may have comparative rather than absolute value.
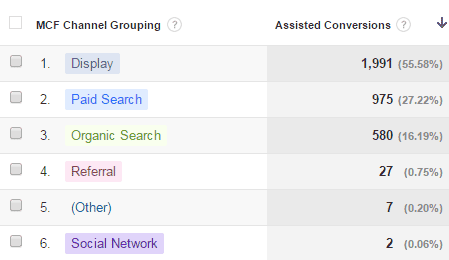
In Google Analytics, assists and post-impression effects can be measured under Conversion > Multi-Channel Funnel > Assisted Conversions
How willing is a person to be interrupted?
An individual's capacity for interruptions is already saturated by non-advertising messages and communications.
This scenario may seem catastrophic, but it is simply the effect of a period of change.
The future of promotional and digital strategies must move towards pull activities aimed at attracting and engaging customers and making them fall in love with the brand (inbound marketing).
Push and banners are not dead, but they must be used sensibly, precisely and in coordination.
Display use also depends on the following factors:
- Market
- Brand
- Target audience
- Goal (for example, brand or product awareness, communicating a promotion, and so on)
- Stage of the customer's journey or buying cycle
For example, if the aim is to raise awareness of a new women's hair product from a well-known brand, display can be an excellent tool.
Here are some suggestions and solutions for getting the most from display investment and trying to limit the problems discussed so far.
Google Display Network
Google is certainly famous for SEA (search engine advertising), auctioning text ads at the top of search results. But it also has a huge network of small and large websites and apps in which to invest.
Google also has one of the world's most efficient and strict click-fraud detection systems, and network publishers are constantly monitored.
Formats can be text-only, images or video.
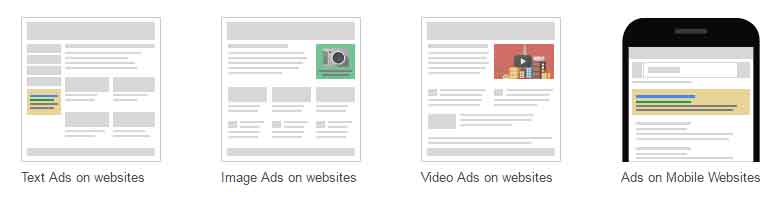
My advice is to invest on a cost-per-click basis, choose a relevant target category and explore the sector, then analyse the results and see which sites perform best.
The next step is to select the best sites and find the point of diminishing marginal returns. Sometimes the discovery phase uncovers gems that might even be worth acquiring for certain brands :-)
Google allows you to choose categories, keywords associated with content and specific placements on a site.
When it comes to buying a specific audience, Facebook is currently the best tool!
Make use of all the targeting options it offers: geographical location, interests, demographics, behaviours and connections.
Unlike many other channels, Facebook users are logged in, overcoming all the limitations of cookie-based tracking!
Remarketing or retargeting
The best way to maximise display investment is to use remarketing techniques. These let us track visitors' behaviour through dedicated tags that store data in cookies, then follow them with our messages across remarketing networks of sites (see the diagram below).
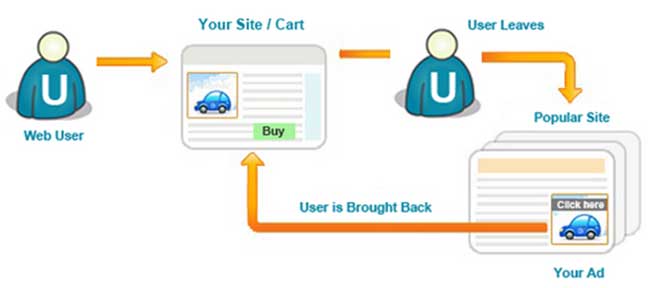
Diagram of how remarketing works
Various remarketing tags can be added to a page; the best-known is DoubleClick's.
Add the Facebook pixel to your pages to build a Facebook remarketing list. You can then show ads only to people who have visited your site or taken a particular action, such as abandoning their shopping basket (here is the complete guide to adding it to your website.
Google Analytics can create even more powerful lists using the variables available on the platform. For example, we could create a list of visitors who use a Mac operating system and arrived through search. The list can be used on Google's network and, through DoubleClick, on many others.
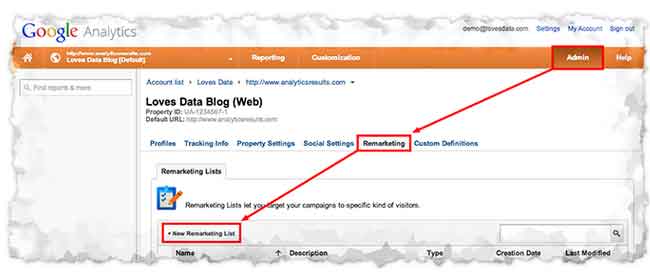
How to create retargeting lists with Google Analytics
If you have an email list, both Facebook and Google offer a very powerful remarketing tool that lets you create an audience by uploading the addresses to their platform.
CAUTION: remarketing must be used carefully, because it can backfire on potential customers who feel pursued while browsing, almost as though they are being stalked.
It is important to vary messages according to the customer's stage and to clean lists so that you do not keep pushing a product or service to someone who has already bought it!
Buying through sales houses or programmatically
To reduce risks and ensure campaign quality, it is worth using sales houses and publishers with proven reliability.
Choose the best site in the network according to your goals and audience, and evaluate its results. Buy with guaranteed delivery. During low season, you could test bulk purchases in general rotation across the sales house's sites, meaning no guarantee of which site will display the banner.
Programmatic automates the process of buying and reserving placements, theoretically including traditional placements guaranteed by sales houses (Programmatic Guaranteed, alongside Private Market Exchange and Private Exchange). But the best-known and most dangerous form is open auctions. Their success comes from publishers' need to move unsold inventory quickly and advertisers' desire to pay little for large quantities of traffic.
Many ad networks converge here, and buying is no longer site-based but audience-based, measured through various tags and beacons.
In the name of audience targeting, provenance is lost! Be meticulous.
I recommend buying on these networks primarily through remarketing, then paying extremely close attention to traffic indicators.
With programmatic, unfortunately even serious, reliable agencies risk encountering fraudulent traffic sources, especially when large traffic volumes are requested quickly.
It is better to spend a little more and be able to monitor results and sources properly.
Impact and context
In a world of indifference and blindness towards display advertising, a good remedy is to create ads that provide value to users and appear in the right context.
We have seen that remarketing can help define the context and the prospect's stage in the buying process.
We need to delight the audience, not annoy it!
If we get these two elements right, the chances of a banner being seen and clicked rise considerably.
If awareness is the goal, favour formats that should have a high probability of being seen, such as takeovers on well-known sites.

Example of a takeover: the advertising space is shown in blue
Below is a very useful tool from Moat, the company specialising in ad-viewability measurement. It lets you see the history of many banners published online and search by brand: an excellent way to find inspiration or study competitors' activity.
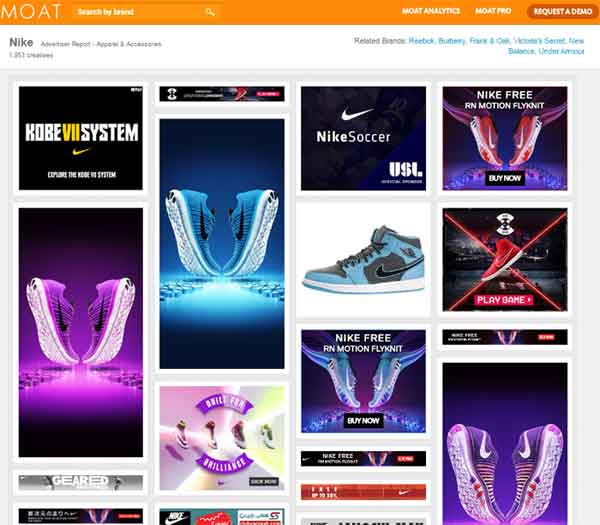
Moat's tool for searching online banners
Monitoring, quality and ROI
The most important thing for any company investing in digital channels is an internal analytics system.
During monitoring, it is important to analyse the metrics discussed earlier — impressions, ad viewability, clicks, CTR, visits and bounce rate — and build the acquisition funnel.
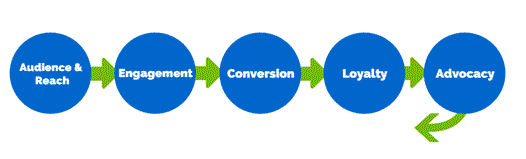
At the top of the funnel, we need to drill down by campaign and analyse source sites and formats. In practice, we need to know where and how our banners are displayed!!
It is also important to have both historical and current creative information for every format.
The central point of the funnel is acquisition. The analytics system must deduplicate conversions across all paid and unpaid channels, such as organic search, links and social visits.
The starting attribution model is based on the last engagement channel. To measure the effect of channels working at the early stage, an assist-based report is needed, as discussed above.
When analysing traffic, pay particular attention to indicators of anomalies:
- a CTR that is too low or too high
- a high bounce rate, indicating click fraud, poor traffic quality or low relevance
- a sudden increase in traffic from unknown advertising networks
- abnormal conversion rates, typically occurring when buying on a CPL, cost-per-lead, basis
For Google Analytics experts, I recommend creating advanced segments based on the campaigns to monitor, so that all on-site behaviour can be examined thoroughly.
Unfortunately, anomalous traffic usually escapes analytics detection because it comes from real computers associated with real user profiles and all their online traces.
In the past, the trick for identifying it was to observe geographical origin, time and service provider.
It is like receiving a “Neapolitan parcel” scam and putting the parcel on the sideboard without opening it :-)
Visitors are not all alike, and increasing traffic by 10% does not automatically increase conversions by the same percentage.
One-off traffic spikes typically send conversion rates plummeting. To isolate this effect, simply observe the conversion rate of organic search visits.
The focus should be on traffic quality rather than quantity.
Traffic quality is reflected in CTR, on-site behaviour, return rate and conversions.
The best way to assess display advertising is to see whether the number of conversions (sales, leads and so on) rises over a period defined beforehand. Even when working on awareness, we should see positive effects on sales performance.
To isolate the effect better, run display campaigns for a period and compare it with another period without advertising. Clearly, the two periods must be comparable in seasonality, competitive situation, pricing and so on.
The aim is always to assess return on investment, understand the marginal result and compare it with alternative media.
For the same target audience, you might discover that some online campaigns have a higher cost per contact than television!